Many posts have discussed economic and educational inequality. The effects of inequality reach many corners of American life.
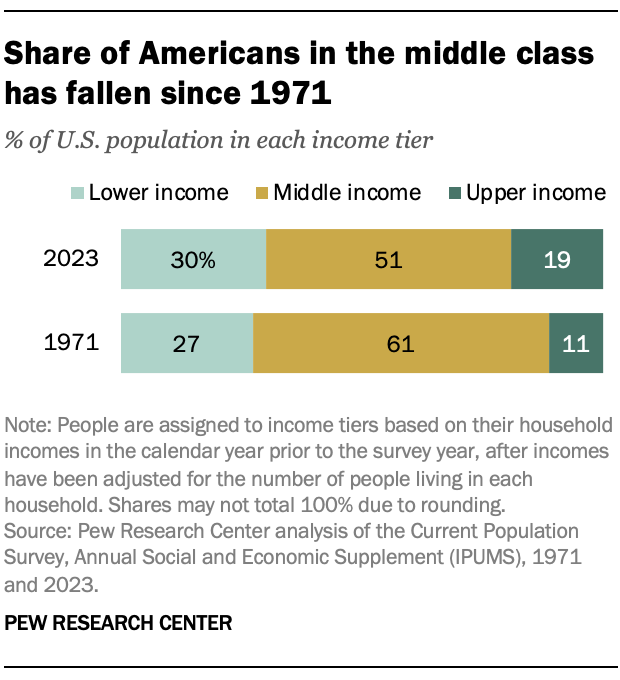
The share of Americans who are in the middle class is smaller than it used to be. In 1971, 61% of Americans lived in middle-class households. By 2023, the share had fallen to 51%, according to a new Pew Research Center analysis of government data.

As a result, Americans are more apart than before financially. From 1971 to 2023, the share of Americans who live in lower-income households increased from 27% to 30%, and the share in upper-income households increased from 11% to 19%.
Notably, the increase in the share who are upper income was greater than the increase in the share who are lower income. In that sense, these changes are also a sign of economic progress overall.
But the middle class has fallen behind on two key counts. The growth in income for the middle class since 1970 has not kept pace with the growth in income for the upper-income tier. And the share of total U.S. household income held by the middle class has plunged.
Moreover, many groups still lag in their presence in the middle- and upper-income tiers. For instance, American Indians or Alaska Natives, Black and Hispanic Americans, and people who are not married are more likely than average to be in the lower-income tier. Several metro areas in the U.S. Southwest also have high shares of residents who are in the lower-income tier, after adjusting for differences in cost of living across areas.
Our report focuses on the current state of the American middle class. First, we examine changes in the financial well-being of the middle class and other income tiers since 1970. This is based on data from the Annual Social and Economic Supplements (ASEC) of the Current Population Survey (CPS), conducted from 1971 to 2023.
Then, we report on the attributes of people who were more or less likely to be middle class in 2022. Our focus is on their race and ethnicity, age, gender, marital and veteran status, place of birth, ancestry, education, occupation, industry, and metropolitan area of residence. These estimates are derived from American Community Survey (ACS) data and differ slightly from the CPS-based estimates. In part, that is because incomes can be adjusted for the local area cost of living only with the ACS data. (Refer to the methodology for details on these two data sources.)
