Religion and Party
Many posts have
discussed the
role of
religion in
American life.
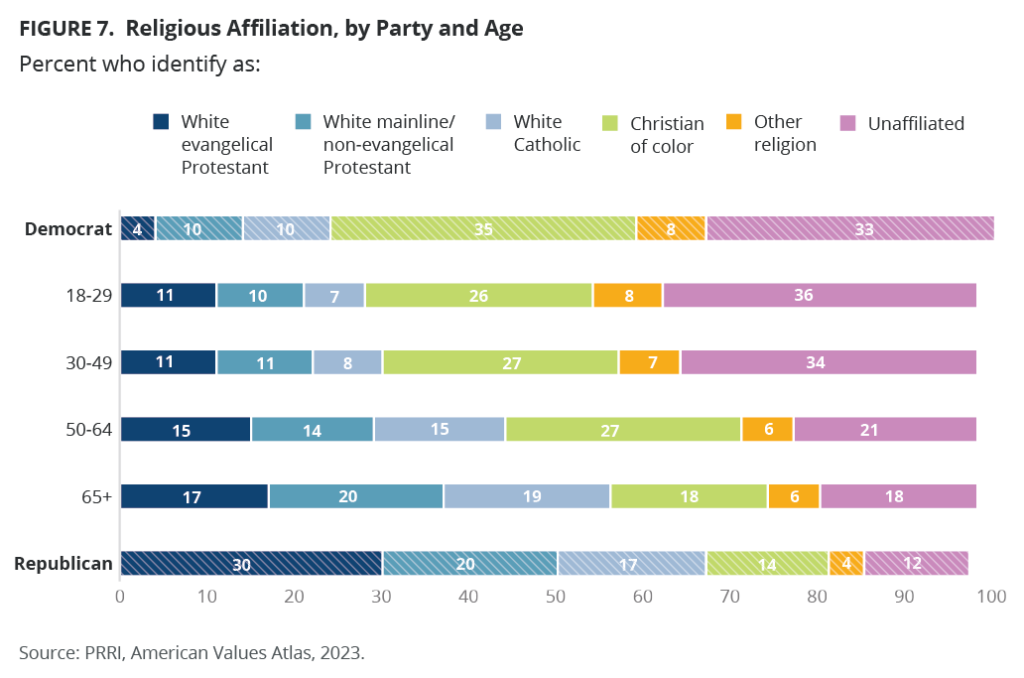
2023 PRRI Census of American Religion: County-Level Data on Religious Identity and DiversityThe majority of both major political parties identify as Christian. However, Republicans (84%) are 25 percentage points more likely than Democrats (59%) to do so. The biggest difference in the religious makeup of self-identified Republicans and Democrats is the proportion of white Christians, compared with Christians of color and the religiously unaffiliated. Seven in ten Republicans (70%) identify as white and Christian, compared with just 24% of Democrats. Among Republicans, 30% are white evangelical Protestants, 20% are white mainline/non-evangelical Protestants, and 17% are white Catholics. Among Democrats, those numbers fall to 4%, 10%, and 10%, respectively.
By contrast, 16% of Democrats are Black Protestants and 11% are Hispanic Catholics, compared with just 1% and 5%, respectively, among Republicans. Similar shares of Republicans (4%) and Democrats (3%) identify as Hispanic Protestant. Democrats (33%) are nearly three times as likely as Republicans (12%) to identify as religiously unaffiliated.
The religious makeup of Democrats generally resembles that of younger Americans ages 18–29. Three in ten young Americans ages 18-29 identify as white Christian (30%), 26% as Christians of color, 8% as another religion, and 36% as religiously unaffiliated. Similar shares of Americans ages 30–49 also identify as white Christian (32%), Christian of color (27%), another religion (7%), and unaffiliated (34%). About half of Americans ages 50-64 identify as white Christian (46%), 27% as Christian of color, 6% as another religion, and 21% as religiously unaffiliated. The Republican religious breakdown is more akin to the religious makeup of senior Americans over 65, whose majority identify as white Christian (58%), 18% as Christian of color, 6% as another religion, and 18% as unaffiliated. Notably, no age group is as white and Christian as Republicans.
Democrats have seen a more dramatic decrease in the share of Christians and an increase in unaffiliated since 2013, though Republicans have also seen this shift. Among both Democrats and Republicans, most of their decline in Christian affiliation is among white evangelical Protestants, who have declined by 4 percentage points among Republicans (from 34% in 2013 to 30% in 2023) and by 5 percentage points among Democrats (from 9% in 2013 to 4% in 2023). The share of the religiously unaffiliated has increased by 11 percentage points among Democrats (from 22% in 2013 to 33% in 2023) and remained relatively steady among Republicans.

